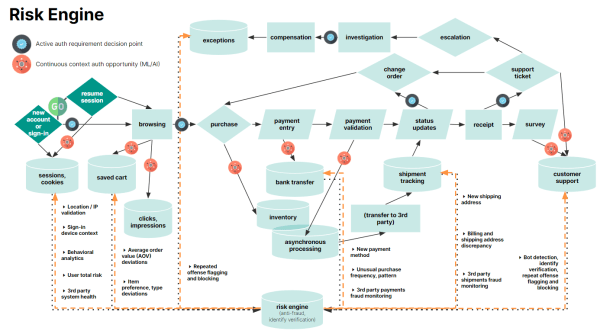
Here is a current state analysis I put together on the topic of sign-in and authentication technology. With the FIDO standard gaining momentum across many industries, I think it's important for companies to take a step back and take necessary steps to ensure they are protecting their data and customers without compromising on reliability or... Continue Reading →
Chicago Micromobility Demand & Station Analysis
This analysis features Chicago Divvy bikeshare and weather data. When compared to my previously posted San Francisco Micromobility Supply & Demand Analysis, there are a few key differences: More complex datasets require more complex data prep. With the addition of demographic and to/from station information come additional steps in validating the data and extracting assumptions... Continue Reading →
San Francisco Micromobility Supply & Demand Analysis
This analysis features a sample anonymized micromobility dataset which I used to delve into supply and demand measurement and data visualization. Here are some highlights of what I hope to illustrate with this analysis: Data prep is paramount. It is important to always do a preliminary analysis of the data to identify and remove outliers,... Continue Reading →
How to Harness Chaos and Build Great Products
I tend to do a lot of thinking about thinking. Perhaps in another life I would be better suited as an epistemology expert. Alas, I'll do what I can in this life. In my latest Medium article, How to Harness Chaos and Build Great Products, I explore the topic of chaos in the context of... Continue Reading →
Wait, But Why for Micromobility Part I
I created this "Wait, But Why" for micromobility more than a year ago, but I'd like to share it as part of my portfolio for a few reasons: Human transportation logistics becomes overwhelmingly complicated especially when passenger and vehicle are decoupled. When dealing with complicated problems, it helps to lay the groundwork by building upwards... Continue Reading →
Why It Took Me 5 Years to Build My First Gaming PC
Getting users to adopt a product that's new for them (but might be decades old for the rest of adopters!) can be a real kick in teeth. In this Medium post, I write about Why It Took Me 5 Years to Build My First Gaming PC which dives into my personal experience with adopting custom... Continue Reading →
Why Analytics Matter in Product – Alumni Stories with Former Fitbit PM
Check out my Product School alumni interview: Why Analytics Matter in Product — Alumni Stories with Former Fitbit PM. Click here to read the full article.
Google Speech-to-Text API Guide
Earlier today, I published a Medium article: Converting Audio Recorded Speech to Text using Google’s Speech-to-Text API, Drive, Cloud Storage, and Colaboratory. My intention with this post is to help tech savvy user researchers easily and systematically use Python to transcribe audio files into text using Google's suite of products. Why? Because I had searched... Continue Reading →
Sustainability and Accountability at Skip
I'm proud and excited to have played a major role in the direction, measurement, execution, and planning for Skip's latest blog post, check it out here: Sustainability and Accountability. Click here to read the full article.
Scooter Tip-over Detection
Today, Skip announced tip-over detection in the Medium article Announcing Tip-Over Detection. I'm proud to be part of the team working on improving awareness and transparency into issues like scooter tip-overs. The article links to the public dataset where anyone can download and analyze the data. It'll be interesting to see what people come up... Continue Reading →
Test Riding the New Skip S3
Two weeks into the job and I've been featured in a photo in The Verge riding the new custom-built Skip S3 electric scooter, see the article Skip’s new scooter has a sturdier deck, bigger wheels, and a swappable battery. The first thing that impressed me about the scooter was the incredible smoothness and stability. Riding... Continue Reading →
Mapping
Something I've recently become immersed into is open source mapping technology. Above is an example of an interactive 3D map I created by using Python, GeoPandas, and Kepler GL. I love iterating and joining additional layers and detail to maps as I discover public data sets. In work that I've done recently with maps, I've... Continue Reading →
Single Source of Truth Reporting
Too much reporting can be a symptom of underlying issues, including 1) no one trusts the data, 2) no one trusts how the data is being aggregated or processed, 3) there's conflicting reporting showing different results, and 4) the meaning of the data is obfuscated by missing information about data filtering and logic. Getting to... Continue Reading →
Machine Learning & Natural Language Processing
Working in Jupyter Lab/Notebook on one's own computer is fairly straightforward. When you add add more team members; however, the equation becomes more difficult. Keeping a shared set of utility functions, libraries, package versions, etc. standardized across multiple projects and people can lead to obstacles. By mapping out how the workflows can effectively coalesce to... Continue Reading →
Tableau Server Administration
When hosting a data visualization portal using Tableau Server, the top areas to monitor are server performance (loading times) and usage (page views). Each are no good without each other. Personally, I've racked up 7+ years of experience with Tableau Desktop and Server and 3 official Tableau certifications. I also spent 2+ years developing additional... Continue Reading →
Python Lambda Functions & Regex for Data Hygiene
Not having a rigorous process in place for data hygiene can lead to unnecessary blockers in data pipeline building. I experienced this with my team when delving into natural language processing (NLP) and text analytics work. We faced challenges when it came to receiving data from different sources such as email, chat transcripts, social media... Continue Reading →
Google App Scripts
In my experience, especially in working with Operations teams, I've come to learn that using tools such as Google Sheets and Google Drive is the best option for record-keeping relatively small datasets. Google App Scripts is an immensely configurable, easy-to-code, lightweight solution for these situations. I've set up many different Google App Script jobs, some... Continue Reading →
Apache Aurora Framework
Appropriately allocating resources for distributed system job automation can be a key responsibility of any data team, especially if the data landscape and scope is large. If resources are constrained, it is increasingly important to understand and communicate tradeoffs between fresh data and highly performant data visualizations. Creating a versatile set of templates that can... Continue Reading →
Core Principles Honed @ Fitbit
[In no particular order] Follow Through Speak your intentions and follow through. Requirements First Vetting a must. Build with requirements clearly laid out. Ask and answer questions before building. Release, Measure, Learn Six week release cycle. Each release cycle informs the next. Iteration with purpose. Process documentation along the entire way. Measure outcomes and adoption.... Continue Reading →
Web & Mobile App Usage & Adoption Reporting
When companies invest in new applications that bring previously untapped potential and increased efficiency to their internal organizations, it's important to track usage and adoption to share progress with key stakeholders and decision makers. Below is an example of a report I created to track logins and engagement in a web and mobile application used... Continue Reading →
Online Reporting Portal for Marketing & Sales Teams
This is a sample of a reporting suite product for which I created the content, branding, and style. The reports thread together data to help sales and marketing teams convert pipeline into sales. The approach for the reports is centered around the users analyzing, predicting and identifying customer buying patterns using segmentation, profiling, share-of-wallet, buying... Continue Reading →
Wiki Documentation
Organized documentation is very important when it comes to growing and maintaining a product and/or service. Having living breathing documents that hold technical and non-technical knowledge is indispensable to the success of any business that hopes to scale up its efforts over time. Below are some samples of Confluence documentation spaces I have created during... Continue Reading →
Technical Process Diagrams
In order to convey the various potential options for processes for updating a very large database with live users, I created the following diagrams.
Business Intelligence Reporting
Through my work developing business intelligence reporting for Fortune 500 companies, I have spent many hours honing my skills in Excel, Tableau, and other reporting platforms. See the below example reporting suite I created in Tableau, used to measure the performance of a sales team in selling electronic components.
SQL Code – Lead to Sales Attribution
Below is a sample of SQL code I wrote for a project with the goal of connecting disparate data sources, specifically leads from marketing automation databases (Eloqua, etc.) to CRM opportunities and sales (Salesforce).
Predictive Analytics Report in Excel
As a fun side project one year, I developed a predictive analytics report in Excel that would show products that were at a high likelihood for purchase based on first purchase behaviors for office supplies customers. The idea came from seeing the types of recommendations Amazon.com gave me after I clicked around their site. My... Continue Reading →
Conference Program Design
Every year, Ashoka U runs a three day conference where participants come together to share how they use their classrooms, departments, institutions, communities and beyond to catalyze long-term change and social impact. Below is the program from the 2014 Brown University conference that I designed.
Ad Space Sales
During my time at the nonprofit Ashoka U, I owned the management, marketing, and sales of advertising space in a yearly publication. Below is a sample one-pager I created for providing guidelines and specifications for advertising space as well as the final product of advertising pages. Ad Space Sales One Pager
Global Data Collection Methodology
The Ashoka U Census was a global campaign to aggregate data concerning social innovation and social entrepreneurship programs around the world. Below is the methodology I used to collect data for the Census using Qualtrics.
Infographics
With thousands of hours of experience working with Adobe products such as Photoshop, InDesign, Illustrator, and Lightroom, I have helped many organizations with their design needs. Here are some samples of my work, specifically from my work with the nonprofit Ashoka U: Daily Progress Infographic for Crowdfunding Campaign 5 Years of Ashoka U Infographic
Lesson Plan – Food Chemistry Course
As a child, I attended Johns Hopkins University's Center for Talented Youth program for five summers taking courses ranging from inductive and deductive reasoning, to essay writing, to etymologies. Throughout my professional career, I continue to strive to give back to the community and positively influence children by teaching courses at the summer camp. I've... Continue Reading →
You must be logged in to post a comment.