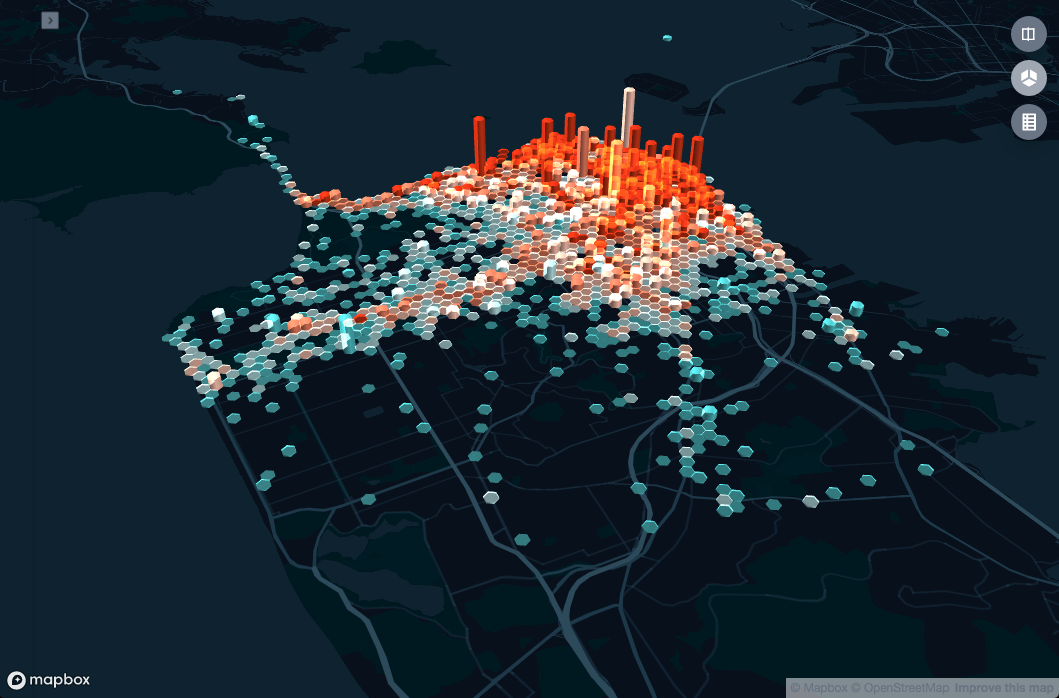
Something I’ve recently become immersed into is open source mapping technology. Above is an example of an interactive 3D map I created by using Python, GeoPandas, and Kepler GL. I love iterating and joining additional layers and detail to maps as I discover public data sets. In work that I’ve done recently with maps, I’ve utilized publicly available data to add dimensionality such as neighborhoods, topography, public transit stations, commercial districts, population, average per capita income, crime rates, bike accidents, and so much more. When data is visualized spatially, it is easier to see patterns that are not so apparent from tables or charts. Even better is the ability to create a time lapse and show the movement of points across time and space.

You must be logged in to post a comment.